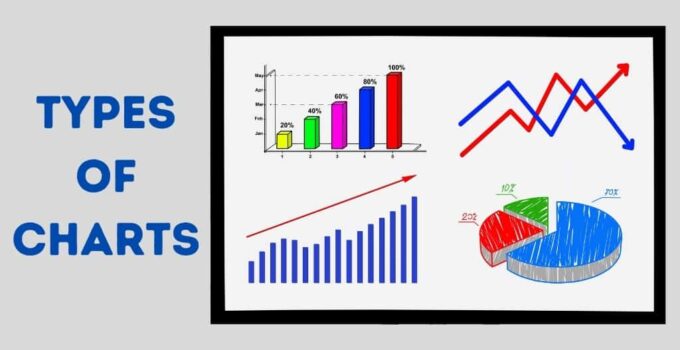
There are different types of charts available for technical analysis. Below are the most commonly used charts for stock study.
- Line Chart
- Bar Chart
- Japanese Candlestick
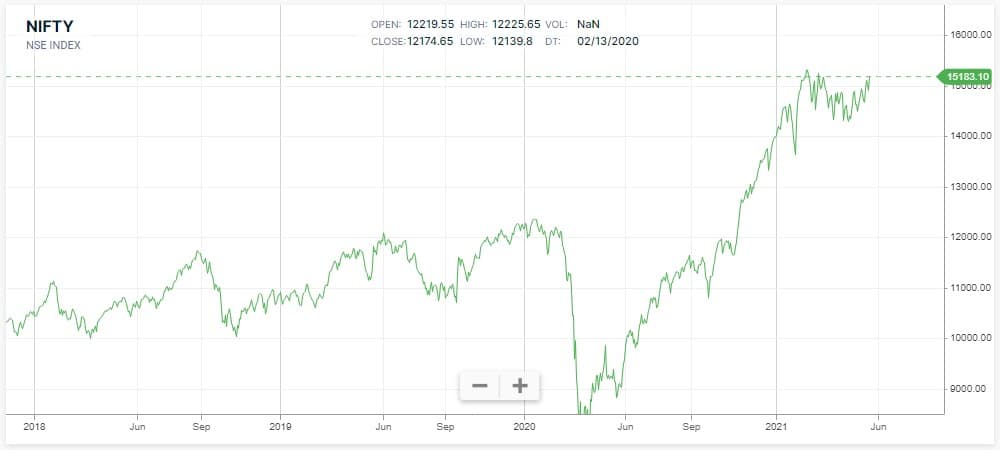
Line Chart
Line chart is the simplest form of chart. Figure below shows a line chart. In line chart only the closing price of each day is plotted as against the open, high low and close which is plotted in a bar chart of candlestick chart.
Bar Chart
Bar charts are some of the most popular type of charts used in technical analysis. As illustrated on the left, the top of the vertical line indicates the highest price a security traded at during the day, and the bottom represents the lowest price. The closing price is displayed on the right side of the bar and the opening price is shown on the left side of the bar. A single bar like the one to the left represents one day of trading.
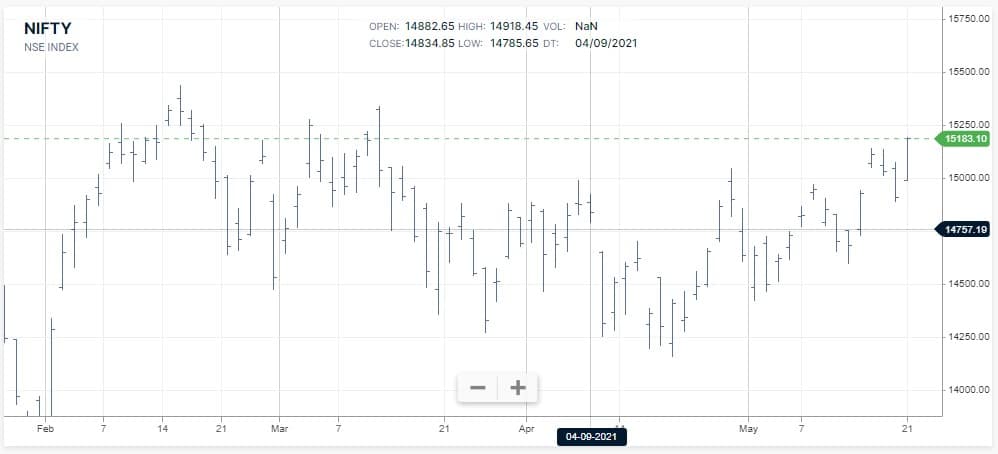
The advantage of using a bar chart over a straight-line graph is that it shows the high, low, open and close for each particular day. This is the type of chart we will be using to display various indicators.
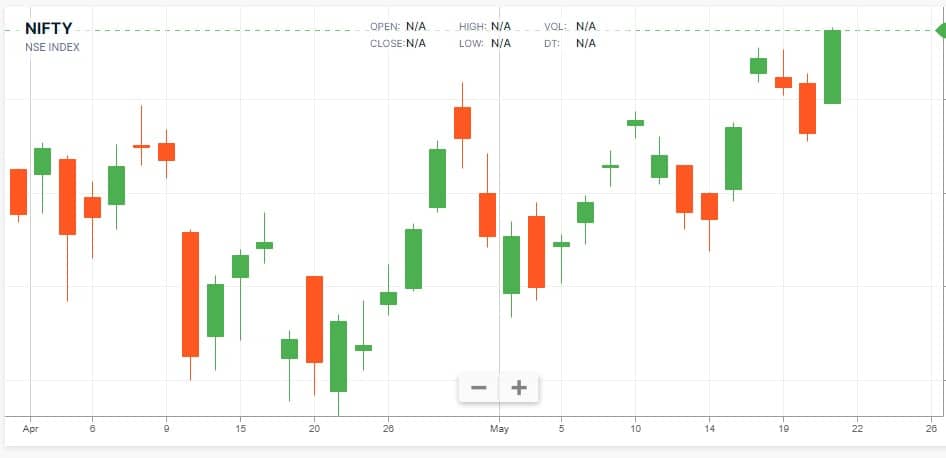
Japanese Candlestick Charting
Candlestick charts have been around for hundreds of years. Candlestick charting was invented in Japan hence They are often referred to as “Japanese Candles” because the Japanese would use them to analyze the price of rice contracts. Similar to a bar chart, candlestick charts also display the open, close, daily high, and daily low. A difference is the use of colour to show if the stock was up or down over the day.
Candlestick charts are the easiest to use compared to all other charting.
Take a look