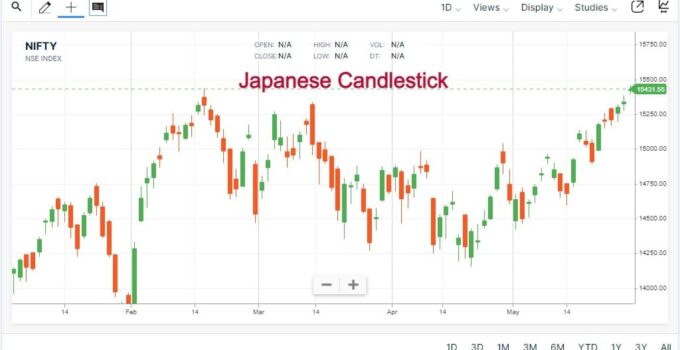
The candlestick charting was invented in Japan. Hence it is also known as Japanese Candle. The use of candlestick charts is easy and simple compared to all other chart types.
Different signals are obtained using a single candle or a combination of several candles. Candlestick charts capture the ups and downs of the market very well. When you use a candlestick regularly, you will not find any other chart so attractive.
Signs of ups and downs can also be obtained from the structures formed at different levels. We have briefly discussed this topic here. If you want to study it in detail, there are good books available in the market on this subject.
Using two or more candles, it is possible to predict whether the current improvement or decline will continue. Most charting software includes a type of candlestick chart.
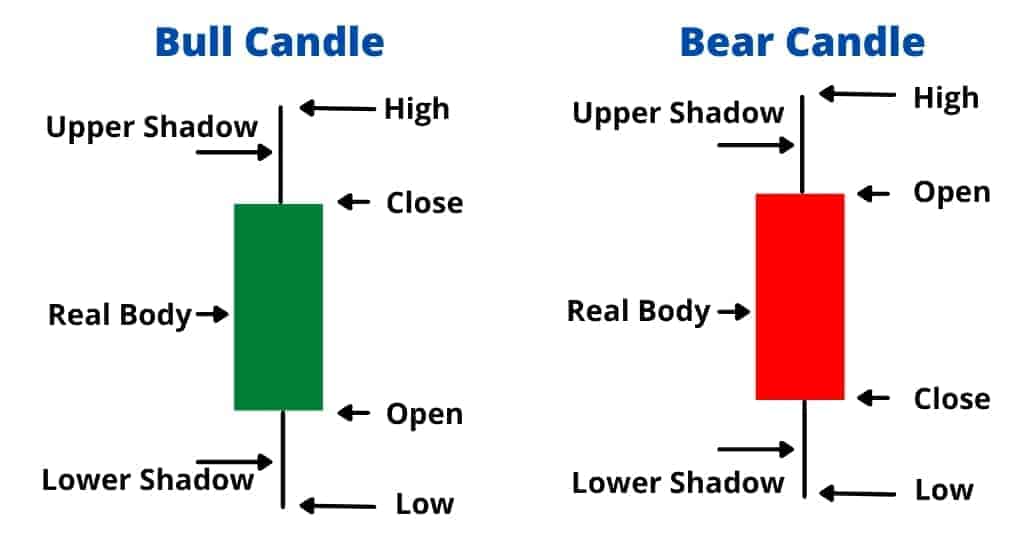
Candlestick Three Main Parts
- Real body
- Upper shadow
- Lower Shadow
Real Body
- The center of the candlestick is called the real body.
- The size of the real body depends on the amount of growth and decline that day.
- If there is a limited correction, a small white or gray (similar to the color fixed for correction) color candle appears.
- Long candles are formed when prices close with a big increase or decrease on the second day compared to the previous day.
- White or blue color is used for candles for the direction of improvement. Black or red is used for the fall. It is a matter of personal preference.
- If there is no increase or decrease in the price or the previous day’s close is seen above the next day’s price, then the candle that is formed is called a dodge.
Upper Shadow
The upper shadow is the line formed at the top of the real body that represents the maximum price of the day.
Lower Shadow
The lower shadow is the line formed towards the bottom of the real body which indicates the lowest price of the day.
Types of Candles
Let us now understand the different types of single candles.
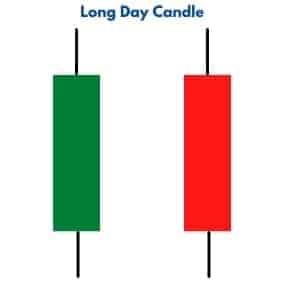
Long Day Candle
This candle shows that there is a big difference in the closing price on this day compared to the previous day. It consists of a long candle.
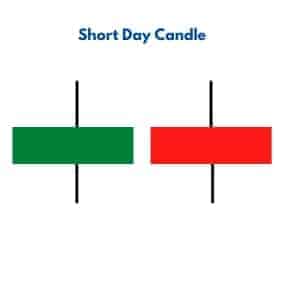
Short Day Candle
The candle shows that the price closes on this day with a much smaller difference than the previous day. It consists of a very small candle.
How to Use Candlestick Chart in Trading?
- First we need to get the signal with the help of a candlestick pattern.
- Combine other technical indicators like Moving averages, Volume etc. with candlestick chart. You can predict the uptrend or the downturn of stock.
- Once you identify movement hold your position according to the signals.
- You can hold your positions until you get the opposite signal.
Take a Look
