As the returns on bank FDs are dwindling, more people move towards the stock market as an investment option. So it is important to understand multiple terminologies & concepts before you start investing.
Investors often perform in-depth research on any stock before investing. This analysis can be classified into two parts, viz. Technical Analysis & Fundamental Analysis
Technical analysis deals with the study of multiple indicators & charts. In contrast, Fundamental analysis deals with the company’s fundamental like its Profit ratio, balance sheet, debt, PE ratio and much more.
In this blog, we will be talking about Moving Average. It is one of the many technical indicators that are vital for speculating the movement of stock.
Let’s get going.
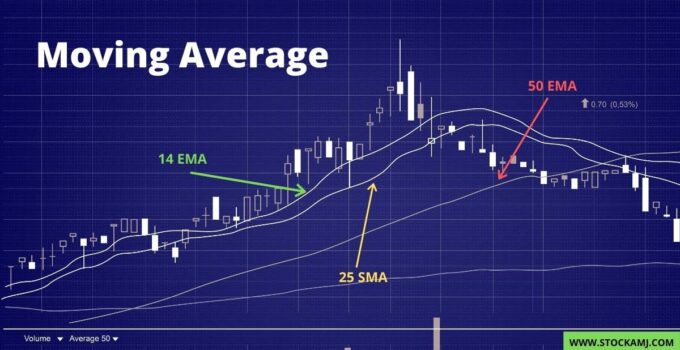
What is Moving Average?
The Moving Average is the average price of any stock over a certain period. It is one of the primary indicators that eliminates random price fluctuations in the stock. It offers a clear understanding of the stock’s price movement over the period. It also helps in determining the Resistance levels & Support levels.
The moving average can be calculated in multiple ways & over multiple periods for, e.g. 30 mins, 1 hr, 4 hrs, one week or 30 days. In short, this technical indicator can be tailored as per the need of the investor or trader.
Once the CMP (Cash Market Price) of the stock crosses the Moving Average Line, a buy or sell signal is generated. This can offer an excellent investment opportunity at the right time.
Types of Moving Average
The Moving Average can be classified into two types, viz.
- Simple Moving Average (SMA)
- Exponential Moving Average (EMA)
- Weighted Moving Average (WMA)
Simple Moving Average (SMA)
A Simple Moving Average is an average of the closing price of the stock over a specified period. This technical indicator is a simple yet effective tool to understand whether the price will keep up its momentum or it will see a trend reversal.
How is the Simple Moving Average calculated?
A 10-days SMA is calculated by adding the closing price of the stock at the end of each trading day & divided by 10. This will get you the first data point. For the next data point, the closing price of another 10-days will be calculated and divided by 10.
As the new closing price is available at the end of each trading day, the 10 days-SMA moves forward. It is important to note that all the data points are weighted equally. This means it is possible that SMA might not give an accurate signal as per recent trends.
SMA Formula
SMA = (A1 + A2 + A3 + ……….An) / n
| Day | Closing Price | 3 Days M.A | 5 Days M.A |
|---|---|---|---|
| 1 | 500 | ||
| 2 | 524 | ||
| 3 | 536 | (500+524+536)/3=520 | |
| 4 | 550 | (524+536+550)/3=536 | |
| 5 | 560 | (536+550+560)/3=548 | 528 |
| 6 | 578 | (550+560+578)/3=562 | 550 |
| 7 | 604 | (560+578+604)/3=580 | 566 |
Why is SMA Important?
- SMA gives a clear understanding of the trend by eliminating any random price fluctuations.
- SMA helps traders in generating entry & exit signals quickly.
- When the SMA is moving downwards, it shows the down-trend & there is a possibility that the price will go down further. On the contrary, if the SMA shows up-trend, there is a possibility that the price will go up.
Exponential Moving Average (EMA)
The concept of Exponential Moving Average is similar to that of Simple Moving Average. The only difference is, unlike SMA, where all the data points are weighted equally, in EMA, the most recent data points have more weightage & as you go back in time, the weightage reduces.
In simple words, EMA offers a better insight into the recent price-action of any stock than SMA. Like SMA, EMA is used to generate buy or sell signals, depending on the share’s price-movement above or beyond the EMA.
How is the Exponential Moving Average calculated?
EMA give average value closest to actual price value as compare to SMA. EMA moves quickly and calculation of EMA is complicate than other moving averages.
EMA Formula
EMA = Price today x ((Smoothing/(1+Days)) + EMA yesterday ((1-(smoothing/(1+Days))
| Day | Closing Price | 5-Day Exponential Average |
|---|---|---|
| 1 | 500 | 500 |
| 2 | 524 | 508 |
| 3 | 536 | 517.2 |
| 4 | 550 | 528 |
| 5 | 560 | 538.6 |
Why is EMA Important?
- EMA is generally used as a supportive technical indicator.
- Traders generally combine EMA with other Technical indicators to speculate price movement efficiently.
- Combined with the strong Market movement, EMA can be of great help, especially for intraday traders.
But as it gives more weightage to the recent price trends, it is a lot less smooth than SMA.
Weighted Moving Average (WMA)
In weighted moving average each reading is given a specific weight and then multiplied by the reading. This will be termed as weighted close. The weighted close is then summed and divided by the sum of the weights. This Average is called the weighted average.
Then the first reading is omitted from the calculation and one more reading is considered for the purpose of calculation and the process is repeated.
How is the Weighted Moving Average calculated?
| Day | Closing Price | Weight | Weighted Close | 3 Day Weighted Average |
|---|---|---|---|---|
| 1 | 500 | 1 | 500 | |
| 2 | 524 | 2 | 1048 | |
| 3 | 536 | 3 | 1608 | 521* |
3 days weighted close total = 500+1048+1608 = 3126
sum of Wight = 1+2+3 = 6
weighted average = 3126/6 = 521*
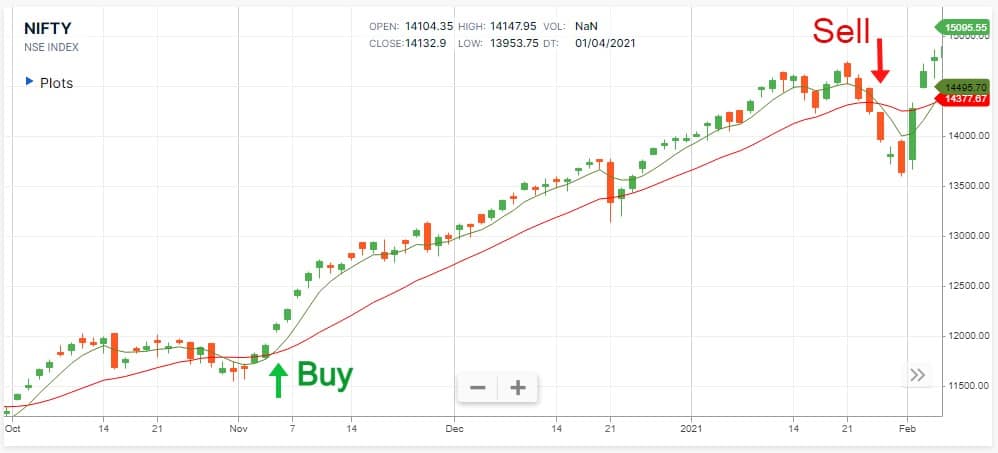
How to use the Moving Average for Buying and Selling?
The simple rule is when the price cuts the average line from the bottom then a buy signal is generated and when the price cuts the average line from the top then sell signal is generated.
There is one shortcoming while following averages for trading or investment decisions. When the market is choppy or moving in a close range then there will be frequent crossovers and one may not be in a position to take a decision.
To overcome this situation it is advisable to use two different types of moving averages. One will be a short-term moving average and the other will be a long term moving average.
As the short term moving average is of a shorter duration it will react faster to the changes in price trends than the long term moving average. The long-term average will be slow and late to react to any price fluctuation than the short term moving average. Thus, when there is an intersection of the two averages buy and sell signals are generated.
When the shorter term average is cutting the longer term average from the bottom a buy signal is generated and if the short term average cuts the longer term average from the top a sell signal is generated.
The 7 days and 25 days weighted moving averages. The cross over of the moving averages generated buy and sell signals.
Note: To generates buy & sell signals we can combine different moving average with each other.
Conclusive Thoughts
SMA, EMA & WMA both are lagging indicators. This means they generally give a signal after the time of entry or exit has elapsed. So it is essential to analyze Market trend & use SMA & EMA, WMA as Supportive indicators. Any wrong move & it can cost investors & traders dearly.
Take a Look