Line Chart in Stock Market

Line Chart Formation in Stock Market

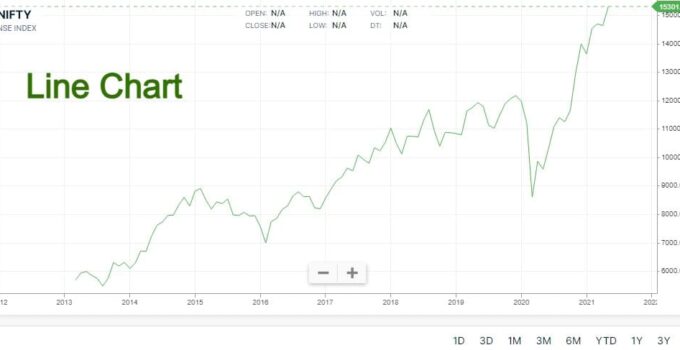
The Line chart is a way to depict the four readings of the scrip/commodity i.e. the open or high or low or close of a single day in a very compact form by putting a tick on the graph and joining the ticks. It is easy to read and analyses the price movement. This chart comprises of a number of opening or high or low or closing prices connected with each other giving a visual effect of line.

Formation of Line Chart

  • A price scale is assigned to the vertical Y axis.
  • A time scale (Minute, Hourly, Daily, Weekly, etc) is assigned to horizontal X axis.

Conclusion

This is most simple, easy and common chart type.

Take a Look

Bar Chart
Japanese Candlestick Chart – How to Use In Trading
Types of Charts in Stock Market
Technical Analysis Advantages and Disadvantages
Moving Average
What is Technical Analysis? How Technical Analysis Work?

Leave a Reply

Wait! Looking for Best Demat Account

"FREE Investing in Stocks & Mutual Funds"

+1 Crore Happy Customers
Zero Brokerage on Equity Delivery Trades
Flat ₹20 or 0.03% (whichever is lower) for Intraday and F&O
Trade with the best platforms and tools

Click & Open Demat Account

Zerodha open an account for online trading
Share via
Copy link
Powered by Social Snap